Knoxville, Tennessee, April 27, 2020 – Mountain Commerce Bancorp, Inc. (the “Company”) (OTCQX: MCBI), the holding company for Mountain Commerce Bank (the “Bank”), today announced earnings and related data as of and for the three months ended March 31, 2020.
Highlights
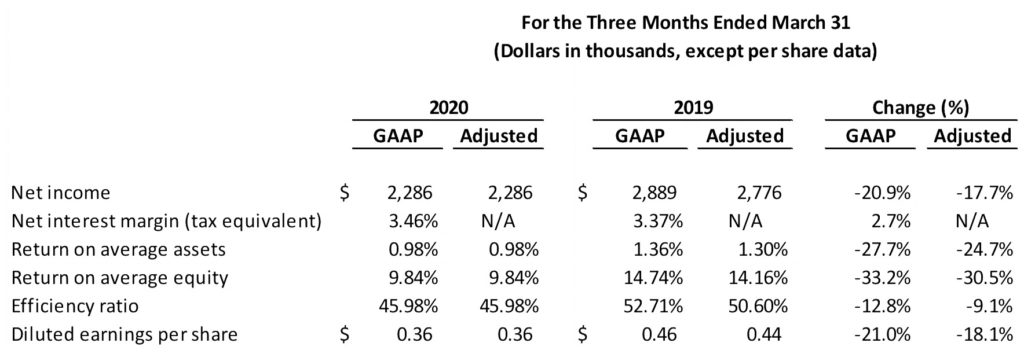
The following tables highlight the trends that the Company believes are most relevant to understanding the performance of the Company. As further detailed in Appendix A to this press release, adjusted results (which are non-GAAP financial measures) reflect adjustments for investment gains and losses and negative provisions for loan losses. See Appendix B to this press release for more information on our tax equivalent net interest margin.


Management Commentary
William E. “Bill” Edwards, III, President and Chief Executive Officer of the Company, commented, “We are pleased that our strong first quarter results will enable the Company to continue to serve its customers during this difficult time that our nation is experiencing. Our first quarter results include an additional $1.5 million of provision for loan losses that was established related to challenges our borrowers may face as a result of the ongoing COVID-19 pandemic. In spite of this significant provision, we still achieved an ROAA of nearly 1% and an ROAE of nearly 10%. I am particularly pleased to report that our efficiency ratio dropped below 46%, which places us among the most efficient community banks in the industry. I am also honored to report that we have been a significant participant in the Small Business Administration’s Paycheck Protection Program (PPP) which has allowed us to help our clients and communities as they attempt to weather the disruption to their businesses cause by the COVID-19 economic shutdown. While it is difficult to accurately predict the next few quarters and the depths and length of the economic challenges our clients will face as a result of COVID-19, I believe that we have the capital and earnings base to weather this storm better than many other financial institutions during this time of uncertainty. As we experienced with the PPP, I expect that we will also be able to attract new clients during this period.”
Net Interest Income
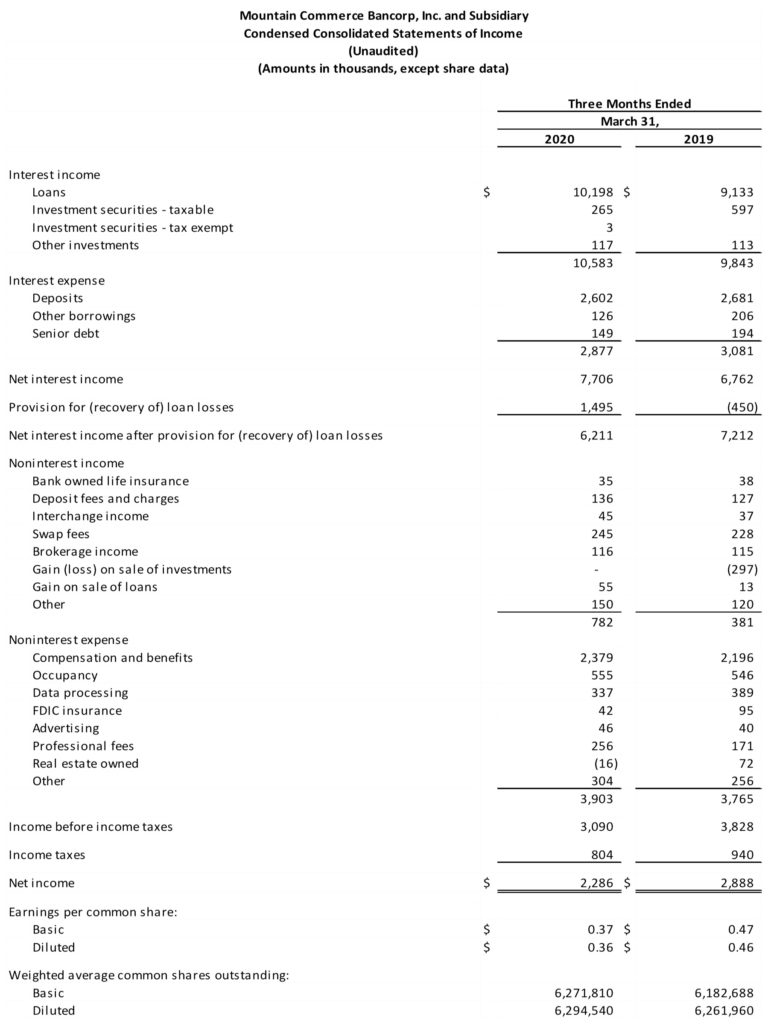
Net interest income increased $0.9 million, or 14.0%, from $6.8 million for the three months ended March 31, 2019 to $7.7 million for the same period in 2020. The increase between the periods was primarily the result of the following three factors:
- Average interest-earning assets grew $81.4 million, or 10.0%, from $814.6 million to $896.1 million.
- Average net interest-earning assets grew $51.3 million, or 36.1%, from $142.0 million to $193.2 million, funded by increased in noninterest bearing deposits and net income.
- Net interest margin increased from 3.37% in the first quarter of 2019 to 3.46% in the first quarter of 2020.
Provision For Loan Losses
A provision for loan losses of $1.5 million was recorded in the first quarter of 2020 as a result of the Company increasing the qualitative factors in its allowance for loan loss model and increasing reserves on certain loans likely to be impacted by the COVID-19 pandemic. A recovery of loan losses of $0.5 million was recorded in the first quarter of 2019.
Noninterest Income
Noninterest income increased $0.4 million, or 205%, from $0.4 million in the first quarter of 2019 to $0.8 million in the first quarter of 2020. The increase was primarily due to $0.3 million of losses on the sale of investments recognized during the first quarter of 2019. The Company also realized modestly higher levels of swap fees and gains from the sale of mortgage loans during the first quarter of 2020 as compared to the same period in the prior year.
Noninterest Expense
Noninterest expense increased $0.1 million, or 3.7%, from $3.8 million in the first quarter of 2019 to $3.9 million in the first quarter of 2020. This modest increase was a contributing factor to the improvement in the Company’s efficiency ratio, which improved from 52.71% (50.60% adjusted) in the first quarter of 2019 to 45.98% in the first quarter of 2020.
Income Taxes
The effective tax rate increased from 24.6% in the first quarter of 2019 to 26.0% in the first quarter of 2020. The increase was primarily due to $0.2 million of deductions in 2019 related to the exercise of nonqualified stock options during the first quarter of 2019.
Balance Sheet
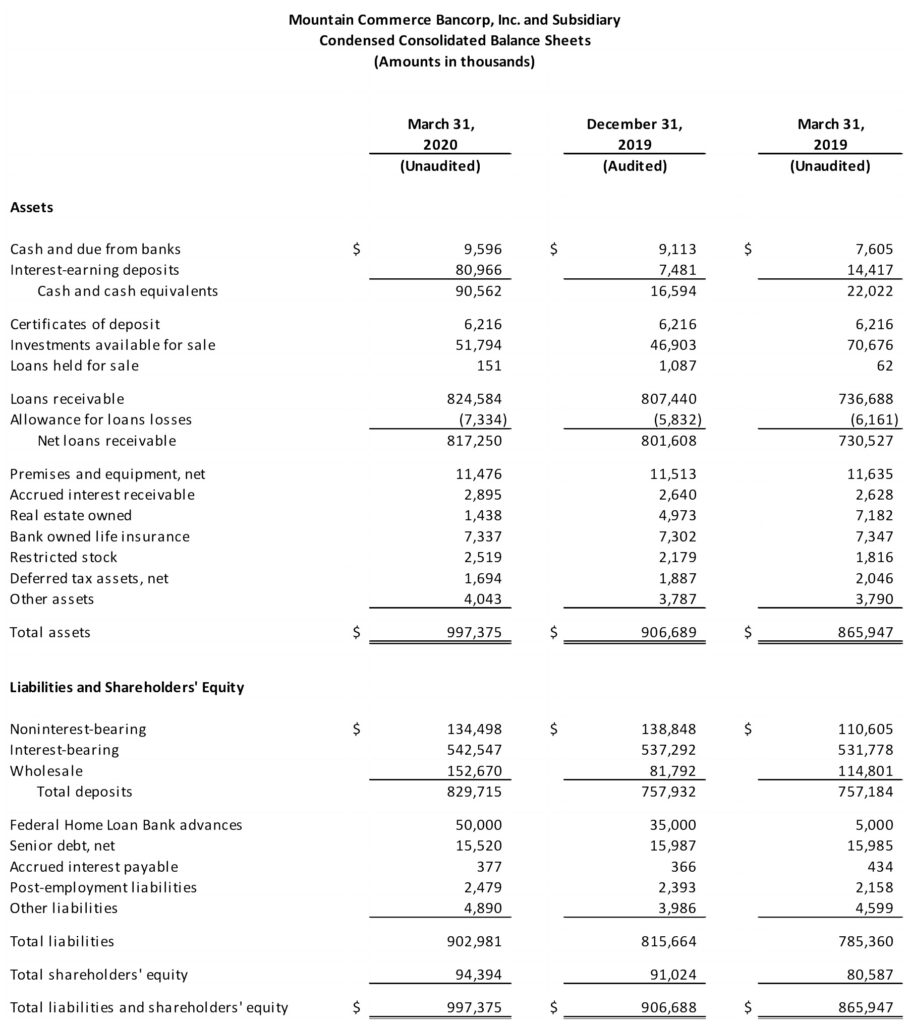
Total assets increased $90.7 million, or 10.0%, from $906.7 million at December 31, 2019 to $997.4 million at March 31, 2020. The increase was primarily driven by the following two factors:
- In the first quarter of 2020, the Company simultaneously entered into a $50.0 million 3 month FHLB advance and a $50.0 million, 5 year pay fixed interest rate swap. The net result of these transactions was to lock in 5 year funding at approximately 43 basis points. This transaction also resulted in a significant improvement in the Company’s liquidity position and increased FHLB advances by $15 million from December 31, 2019 to March 31, 2020.
- Wholesale time deposits increased $70.9 million, or 86.7%, from $81.8 million at December 31, 2019 to $152.7 million at March 31, 2020. This increase funded loan growth for the first quarter of 2020 and lowered the Company’s loan to deposit ratio from 106.5% at December 31, 2019 to 99.4% at March 31, 2020, while improving the Company’s liquidity.
Interest-earning deposits increased by $73.5 million from $7.5 million at December 31, 2019 to $81.0 million at March 31, 2020. The increase was primarily attributable to the proceeds from the $50.0 million swap discussed above. The Company believes it is prudent to maintain higher levels of liquidity during the COVID-19 pandemic.
Loans receivable increased by $17.1 million, an annualized rate of 8.5%, from $807.4 million at December 31, 2019 to $824.6 million at March 31, 2020. The majority of loan growth was concentrated in residential and commercial real estate loans.
Total deposits increased $71.8 million, or 9.5%, from $757.9 million at December 31, 2019 to $829.7 million at March 31, 2020. As previously discussed, the majority of this increase was in wholesale time deposits.
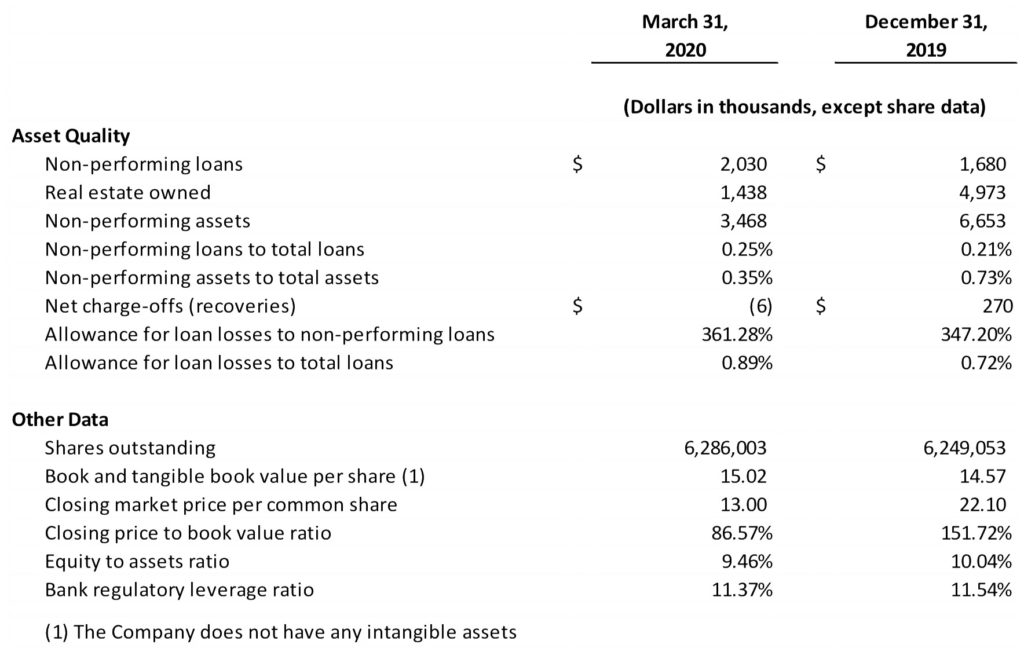
Total equity increased $3.4 million, or 3.7%, from $91.0 million at December 31, 2019 to $94.4 million at March 31, 2020. This increase was primarily comprised of net income of $2.3 million and net improvement in the fair value of the Company’s investments and derivatives of $1.0 million. Tangible book value per share improved from $14.57 at December 31, 2019 to $15.02 at March 31, 2020. Equity to assets declined from 10.04% at December 31, 2019 to 9.46% at March 31, 2020 because of the increase in total assets.
Asset Quality
Non-performing loans to total loans increased slightly from 0.21% at December 31, 2019 to 0.25% at March 31, 2020. The increase was due to the addition of 2 farmland loans for which no loss is currently expected. Non-performing assets to total assets decreased significantly from 0.73% at December 31, 2019 to 0.35% at March 31, 2020, primarily as a result of the sale of several real estate owned properties. Net recoveries of $6 thousand were recognized in the first quarter of 2020. The allowance for loan losses to total loans increased from 0.72% at December 31, 2019 to 0.89% at March 31, 2020 and coverage of non-performing loans remains strong at 361.28% at March 31, 2020.
Non-GAAP Financial Measures
Statements included in this press release include non-GAAP financial measures and should be read along with the accompanying tables in Appendix A, which provide a reconciliation of these non-GAAP financial measures to the most directly comparable GAAP financial measures. This press release and the accompanying tables discuss financial measures such as adjusted net income, adjusted diluted earnings per share, adjusted return on average assets, adjusted return on average equity and adjusted efficiency ratio, which are all non-GAAP financial measures. We believe that such non-GAAP financial measures are useful because they enhance the ability of investors and management to evaluate and compare the Company’s operating results from period to period in a meaningful manner. Non-GAAP financial measures should not be considered as an alternative to any measure of performance calculated pursuant to GAAP, nor are they necessarily comparable to non-GAAP financial measures that may be presented by other companies. Investors should consider the Company’s performance and financial condition as reported under GAAP and all other relevant information when assessing the performance or financial condition of the Company. Non-GAAP financial measures have limitations as analytical tools, and investors should not consider them in isolation or as a substitute for analysis of the Company’s results or financial condition as reported under GAAP.
Forward-Looking Statements
This press release contains forward-looking statements. The words “expect,” “intend,” “should,” “may,” “could,” “believe,” “suspect,” “anticipate,” “seek,” “plan,” “estimate” and similar expressions are intended to identify such forward-looking statements, but other statements not based on historical fact may also be considered forward-looking. Such forward-looking statements involve known and unknown risks and uncertainties that include, without limitation, (i) deterioration in the financial condition of our borrowers resulting in significant increases in loan losses and provisions for those losses, (ii) the effects of the emergence of widespread health emergencies or pandemics, including the magnitude and duration of the COVID-19 pandemic and its impact on general economic and financial market conditions and on our and our customers’ business, results of operations, asset quality and financial condition; (iii) deterioration in the real estate market conditions in our market areas, (iv) the impact of increased competition with other financial institutions, including pricing pressures, and the resulting impact our results, including as a result of compression to our net interest margin, (v) the deterioration of the economy in our market areas, (vi) fluctuations or differences in interest rates on loans or deposits from those that we are modeling or anticipating, including as a result of our inability to better match deposit rates with the changes in the short-term rate environment, or that affect the yield curve, (vii) the ability to grow and retain low-cost core deposits, (viii) significant downturns in the business of one or more large customers, (ix) our inability to maintain the historical growth rate of our loan portfolio, (x) risks of expansion into new geographic or product markets, (xi) the possibility of increased compliance and operational costs as a result of increased regulatory oversight, (xii) our inability to comply with regulatory capital requirements, including those resulting from changes to capital calculation methodologies and required capital maintenance levels, (xiii) changes in state or Federal regulations, policies, or legislation applicable to banks and other financial service providers, including regulatory or legislative developments arising out of current unsettled conditions in the economy, (xiv) changes in capital levels and loan underwriting, credit review or loss reserve policies associated with economic conditions, examination conclusions, or regulatory developments, (xv) inadequate allowance for loan losses, (xvi) results of regulatory examinations, (xvii) the vulnerability of our network and online banking portals, and the systems of parties with whom we contract, to unauthorized access, computer viruses, phishing schemes, spam attacks, human error, natural disasters, power loss and other security breaches, (xviii) the possibility of additional increases to compliance costs as a result of increased regulatory oversight, (xix) loss of key personnel, and (xx) adverse results (including costs, fines, reputational harm and/or other negative effects) from current or future obligatory litigation, examinations or other legal and/or regulatory actions. These risks and uncertainties may cause our actual results or performance to be materially different from any future results or performance expressed or implied by such forward-looking statements. Our future operating results depend on a number of factors which were derived utilizing numerous assumptions that could cause actual results to differ materially from those projected in forward-looking statements.
Mountain Commerce Bancorp, Inc. is the holding company of Mountain Commerce Bank. The Company’s shares of common stock trade on the OTCQX under the symbol “MCBI”.
Mountain Commerce Bank is state-chartered financial institution that traces its history over a century and is headquartered in Knoxville, Tennessee serving East Tennessee through 5 branches located in Erwin, Johnson City, Knoxville and Unicoi. The Bank focuses on relationship banking of small and medium-sized businesses and high net worth individuals who value the personal service and attention that only a community bank can offer. For further information, please visit us at www.mcb.com


